


Six winners from six available years at the Scottish Open — all ranked inside the top four by SG:Tee-to-Green on tournament week. That’s a striking result, but it becomes more interesting when you realise those winning players didn’t all have the same SG subcategory profile. What they shared was something the SG composite captures incompletely: a specific combination of long game attributes that suits Renaissance Club’s demands. Course fit took them from “statistically strong this week” to “statistically strong this week and well-matched to this venue specifically.”
Course fit is the most underused edge in UK golf betting. Not because punters ignore it — most handicap articles mention it — but because most analysis stops at “course history” and treats past results as the whole answer. Past results are a symptom. The underlying cause is the alignment between a player’s ball-striking strengths and the physical demands of the venue. Understanding that alignment requires building a course profile, not just running a results search.
What course fit gives you, practically, is a second filter on top of raw SG form. The first filter asks who is playing well right now. The second asks who is playing well right now in the ways that specifically matter this week. Those two questions can point to quite different players, and the divergence between them is often where the betting value lives. A player who rates fifth in the field by overall SG:T2G but first by the specific SG subcategory most relevant to this particular venue is a more interesting proposition than their headline ranking suggests — and more often than not, the bookmaker odds haven’t fully priced that distinction.
What Course Fit Actually Means
Strip away the jargon and course fit comes down to a simple question: does this player’s way of playing golf match what this specific course rewards? Every venue has its own personality — some reward raw power and long driving, others demand precision iron play and short game finesse. Identifying players whose strengths align with those demands is where value betting in golf most consistently lives.
The reason course fit creates betting value is a structural one. Bookmaker odds are primarily built around world rankings and recent form — broad measures of overall quality. A player ranked 40th in the world at 25/1 is priced as a 40th-ranked player. But if that player’s specific skill set is unusually well-matched to that week’s venue — if their elite approach play aligns with a course that heavily rewards SG:Approach, for example — the market has underpriced them relative to the specific outcome probability for that event.

Course fit is not the same as course history. Course history asks “has this player performed well here before?” Course fit asks “why would this player perform well here, given their current skill profile?” The distinction matters because a player who once contended at a venue on the back of hot putting — which is volatile — is not the same betting prospect as one who contended because their approach play was excellent at a course that consistently rewards it. The former may or may not repeat; the latter has a structural reason to perform well again as long as their form holds.
There’s also a negative course fit dimension that punters underuse. Identifying players who are likely to underperform their ranking at a specific venue — because their weaknesses are exactly what the course punishes — is just as valuable as identifying positive fits. When a favourite has a clear course-fit mismatch, the odds against their nearest competitors become more interesting.
The Variables That Define a Course Profile
Profiling a golf course for betting purposes requires looking at a handful of variables that directly translate into the SG categories most likely to predict winners at that venue.
Course length and par configuration are the starting point. A 7,500-yard par-72 with multiple driveable par-4s rewards elite driving distance and creates opportunities for birdie explosions from long hitters. A tighter, shorter layout — common on older links courses — demands precision off the tee and penalises the player who relies on brute force to compensate for errant driving. Looking at the average winning score relative to par over several years reveals whether birdie festivals or grindy par-events are the norm.

Approach shot difficulty is the next layer. Some courses demand long-iron approach shots into firm, fast greens where controlling spin is critical. Others offer receptive greens from mid-iron distances. The SG:Approach category captures this well — courses where approach shot performance strongly predicts results are identifiable from historical SG data. Renaissance Club, venue for the Scottish Open, consistently shows a high correlation between SG:Approach performance and final position. That’s an empirical observation from the data, not a guess based on watching the broadcast.
Green surface speed and slope affect putting performance — but as I noted in the Strokes Gained piece, putting is the most volatile SG category. Course putting history is useful context but should be weighted less heavily than approach and driving data. One exception: Augusta National. Its green complex is so distinctive — slope, speed, and grain all dramatically above tour standard — that putting performance there has a meaningful predictive role that it doesn’t at most other venues.
Rough penalty is a variable worth assessing separately. Some courses — particularly US Open venues and links courses in adverse conditions — impose severe penalties for missing the fairway. Others have rough that’s punishing visually but barely affects approach distances or shot options. A player with below-average driving accuracy who tends to get away with it because they’re long enough to recover from rough becomes a riskier proposition at a course where rough genuinely constrains recovery options.
Finally, altitude and firmness of conditions affect carry distances and how much run the ball gets. This matters most for approach play: a course at altitude where the ball flies further can favour approach players who typically struggle with distance control on shorter approaches, while a firm links in a dry summer can expose players whose shot shapes don’t match conditions.
Links vs Parkland: Two Fundamentally Different Betting Contexts
The links-versus-parkland distinction is the broadest course-fit division in golf, and it produces genuinely different betting frameworks. Getting this wrong is costly; getting it right consistently is one of the most reliably profitable applications of course-fit analysis I’ve found in nine years of doing this.
Links golf — played on coastal terrain with firm, fast fairways, variable bounces, and prevailing wind as a constant factor — rewards a fundamentally different skill set than parkland golf. Ball flight control, the ability to hit low trajectories under wind, and a short game built around bump-and-run options all become premium skills. Traditional ball-striking metrics, particularly SG:Approach as measured on typical PGA Tour parkland venues, can overstate a player’s links suitability if they’ve built their approach numbers from high-trajectory iron shots that hold soft greens.

Five of the last six Open Championship winners started at 20/1 or longer, with two of those five at 80/1 or above. That variance profile is partly explained by the links setting: the course architecture constrains predictability less than a controlled parkland environment. The wind — which changes direction and strength across the day — creates scoring luck that can elevate a player who navigated the draw timing well above one who played equivalent golf but into worse conditions. The each-way structure is particularly well-matched to The Open for exactly this reason — coverage across a wider finishing range makes sense when the winner is genuinely difficult to identify in advance.
Parkland courses, by contrast, tend to produce more predictable winners. The better ball-strikers with the most complete games consistently bubble to the top of leaderboards at venues like Wentworth, Valderrama, or TPC Sawgrass. SG:T2G prediction models work more cleanly in these environments because the course architecture rewards predictable performance rather than weather-dependent improvisation. When the BMW PGA Championship at Wentworth produces a winner, they’ve almost invariably been a dominant ball-striker that week — the correlation between SG:T2G and final position is tighter than at most links events.
One specific pattern worth noting for UK punters: European players who grew up playing links golf can have an advantage at links venues that their PGA Tour SG statistics don’t fully capture. The tactical knowledge of playing firm, fast courses in wind is built through years of exposure, and it shows up in performances that outrun the model’s predictions. This isn’t a reason to ignore SG — it’s a reason to treat positive course history at links venues from European-based players as a slightly stronger signal than equivalent history at parkland venues.
Wind and Weather as a Betting Variable
Weather is a variable most betting guides treat as unpredictable and therefore dismissible. That’s a mistake. Weather doesn’t need to be accurately predicted to be useful — it needs to be understood structurally. Different types of conditions systematically advantage different player profiles, and when the forecast suggests a specific type of challenge, that information sharpens course-fit analysis.
Wind is the most consistently impactful weather variable in professional golf. A sustained wind above 20mph changes the character of almost any course — but links courses most dramatically. In high wind at a links venue, scoring becomes highly dependent on tee time draw luck, and the range of plausible winning scores expands significantly. This is the conditions profile that most strongly favours backing multiple players each-way rather than concentrating on a single selection, because the outcome distribution has genuinely widened.

Wet, soft conditions alter the game differently. Soft fairways eliminate course length as a differentiator (the ball doesn’t run) and soft greens reduce the premium on trajectory control — approaches from any angle tend to hold. Under soft conditions, courses that normally produce tight scoring windows open up, and the tactical advantage of players who manage distances well on firm ground is reduced. In very soft conditions, courses with long rough become particularly testing because approaches that would normally run through the rough onto the green instead plug.
Cold conditions deserve a mention specific to The Open Championship and Scottish events. Cold, damp air reduces carry distances meaningfully — sometimes by 10-15 yards on driver — which effectively lengthens the course for shorter hitters and reduces the driving distance premium for long hitters. When the forecast for a links Major suggests cold, grey conditions rather than warm and dry, the advantage of raw distance narrows and the premium on trajectory management increases.
The practical application is this: build your course profile first, then check the week’s forecast and ask which player profiles the conditions will advantage. If Carnoustie is forecast for 25mph winds on Thursday and Friday, players with low ball flights and strong links records move up in my assessment relative to those with high-trajectory iron games built for still, parkland conditions. The model doesn’t change — but the weighting within it does.
Reading Historical Results as a Signal
Past results at a specific venue are a signal, not a story. The challenge is knowing when the historical data reflects a genuine underlying match between player and course, and when it’s noise — a single good week on the back of fortunate conditions, a hot putter, or a draw that avoided the worst of the weather.
The most reliable use of course history is as a confirmatory filter. If SG:T2G analysis already points to a player as a strong candidate for a specific event, and they also have a consistent record of performing well at that venue across multiple years, the two signals reinforce each other. The combination is stronger than either alone. Conversely, a player with excellent SG:T2G form but no previous appearances at a venue is not automatically a worse bet — they simply have less confirmation.

Where historical results become genuinely informative is when they show consistent overperformance relative to what SG form alone would predict. A player who has finished top-ten at a specific venue three times in four visits, but whose SG:T2G ranking going into those events was only middling, is worth investigating. They may have course-specific strengths the aggregate SG number doesn’t capture — perhaps exceptional performance in the wind conditions that event typically produces, or a strong putting record on similar green surfaces.
Equally useful is consistent underperformance. A highly-ranked player who repeatedly struggles at a specific venue — not through injury or schedule anomalies, but through genuine course mismatches — is a player to fade when they’re heavily backed at that event. The Scottish Open at Renaissance Club is a useful example: the course demands specific approach play qualities that some elite ball-strikers don’t possess in the right configuration. A player with excellent SG:T2G but built on driving distance rather than approach precision has historically underperformed their ranking there.
The benchmark I use: two or more visits producing results significantly above or below expected based on the player’s SG form entering those events. A single result in either direction is insufficient — golf produces enough variance that any one-week divergence from expected performance could be statistical noise. Two or more divergent results in the same direction at the same venue constitute a meaningful signal. Three or more, combined with a coherent explanation for the course-fit mechanism, is strong enough to materially influence my pre-bet assessment.
Building a Course-Fit Workflow Before You Bet
A course-fit analysis doesn’t need to be elaborate to be effective. The goal is a structured process that surfaces the right candidates and eliminates the wrong ones before you’ve spent any mental energy on odds comparison or each-way term shopping.
First: write a one-sentence course profile. What does this venue reward above all else? For Wentworth: precise long-iron approach play on a parkland layout with receptive greens. For Royal Troon: driving accuracy in wind and a short game capable of manufacturing scores from uneven lies. For Augusta: elite approach play and an ability to putt Augusta’s distinctive slope-and-speed combination. One sentence forces clarity and prevents the analysis from drifting into generalities.
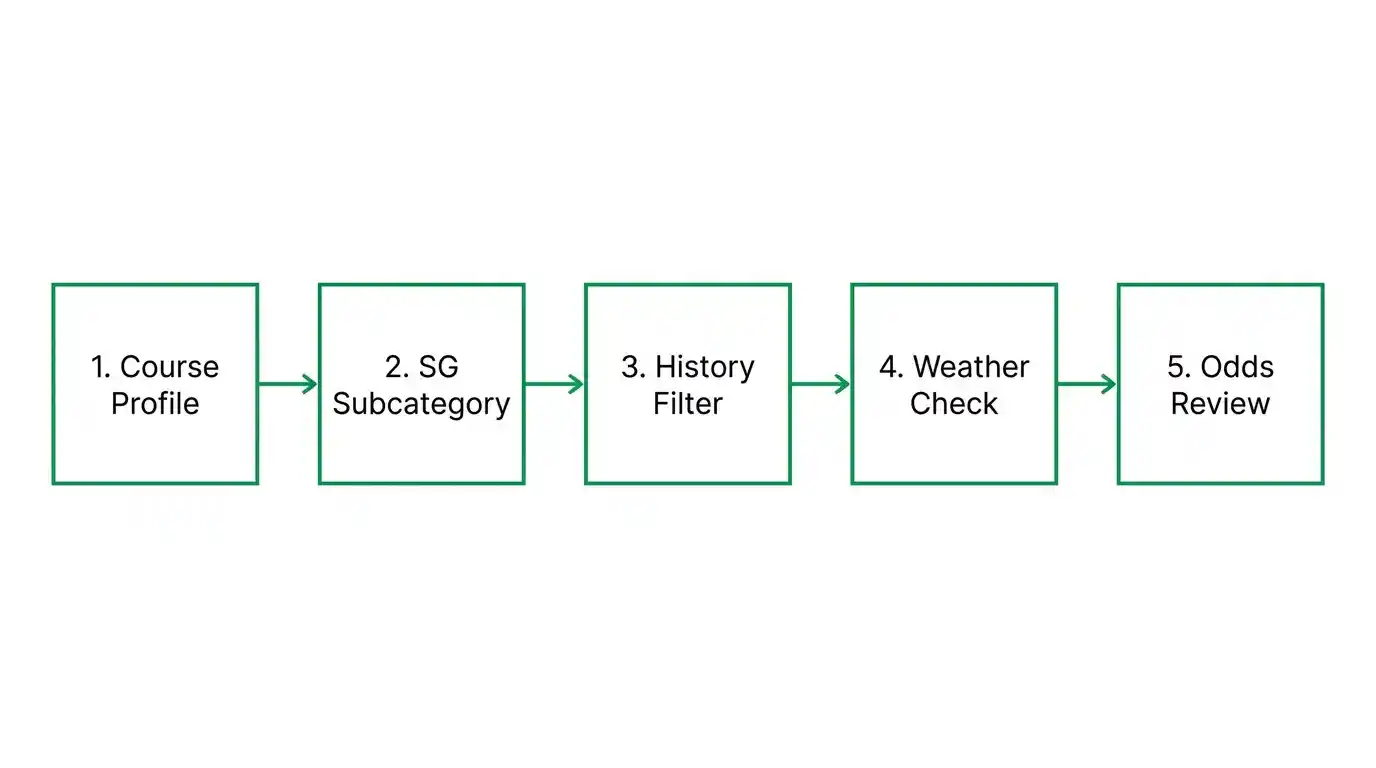
Second: from that profile, identify the one or two SG subcategories most likely to separate the field. For Wentworth, SG:Approach is primary. For links events in wind, SG:Off-the-Tee matters more because drive placement under wind determines the approach shot quality available. Cross-reference the current field against these subcategory rankings, not just SG:T2G composite.
Third: apply the historical filter. For any player who appears in the top tier of your subcategory rankings, check their history at this specific venue. Do their past results align with the course-fit thesis? Have they overperformed or underperformed their SG form at this venue? Make a note — this step is quick but materially affects how much confidence you place in the overall analysis.
Fourth: check the weather forecast and ask whether it modifies any of your assessments. If the forecast suggests conditions that advantage or disadvantage specific player profiles, adjust accordingly. This step takes five minutes and can be the difference between a well-calibrated bet and one built on the wrong assumptions.
For the actual application to betting — combining this course-fit assessment with each-way terms and odds comparison — the process links directly to the broader pre-bet workflow I cover in the main system guide. The course-fit step is one layer in a multi-step analysis, and it works best when integrated with current SG form data rather than used in isolation. The guide on Open Championship betting applies this exact framework to the most volatile and course-specific Major in the calendar.
Frequently Asked Questions
How do I find detailed course statistics for DP World Tour venues?
The DP World Tour official website publishes some course-level statistics for its events, though the depth varies. DataGolf includes course-fit model data for DP World Tour venues in their main interface. For historical SG data by venue, GolfBettingSystem.co.uk maintains event-level analysis going back several years for major DP World Tour events. Third-party statistics platforms that aggregate ShotLink-equivalent data from co-sanctioned events are increasingly useful as the DP World Tour"s data infrastructure has improved.
Does links course experience translate across different links venues?
Partially. The general skills developed through links golf — low trajectories, bump-and-run short game, wind management — transfer broadly. But individual links courses have distinct personalities: St Andrews is flatter and more strategic; Royal Portrush has elevation changes and more dramatic rough; Carnoustie rewards distance control over distance itself. A player with a strong record at one links venue has demonstrated the core skillset but not a guaranteed fit at every other links. The best approach is to treat general links experience as a positive indicator and supplement it with specific course analysis.
How much weight should course history carry vs current SG form?
As a rule of thumb, I weight current SG form around 60-70% and course history at 30-40% — but this varies by how much historical data exists. For a player with four or more visits to a venue showing consistent results, the course history weight can rise toward 40%. For a player with one or two visits, or whose previous visits were more than five years ago, the history is thin enough to treat as supplementary rather than meaningful. SG form reflects the player as they currently are; course history reflects how they"ve responded to a specific environment in the past.
What makes a "weak field" event easier to bet and how do I identify one?
A weak field event is one where the overall depth of competition is lower than a standard full-field tour event — typically because several top-ranked players have opted out due to scheduling conflicts or fatigue. These events can be easier to bet in one sense: the number of genuine contenders is smaller, which concentrates probability. But the bookmaker odds often don"t fully adjust for reduced field strength, which creates value on the few top-tier players who do show up. Check the current world rankings of the field against a standard tour event benchmark to assess field quality.
This material was created by SwingEdge team.
