


Golf betting analysis used to be a matter of glancing at recent finishes, noting who’d played well at the course before, and making an educated guess. That era is over. The gap between punters who use Strokes Gained data and those who don’t has become one of the most persistent structural edges in sports betting — and most UK bettors are on the wrong side of it.
I started integrating SG metrics into my golf betting process around 2015, and the learning curve was steeper than I expected — not because the concept is complicated, but because the instinct to override data with eye-test impressions is hard to shake. A player who looked brilliant in a highlights package but recorded poor SG:Approach numbers that week was a poor bet regardless of how his swing looked. It took a full season of disciplined record-keeping before that became genuinely intuitive.
The traditional maxim that defined golf analysis for decades — “drive for show, putt for dough” — has been statistically demolished by SG research. The best players hit the ball further and more accurately from approach distances. Those parameters are measurable, consistent, and more predictive from week to week than putting statistics, which can be remarkably volatile. Understanding why this is true, and how to translate it into pre-bet analysis, is what separates a quantitative approach from folklore.
Where Strokes Gained Comes From
Strokes Gained was created by Mark Broadie, a professor at Columbia University, working with the ShotLink data system that the PGA Tour has been collecting since the early 2000s. The core insight was deceptively simple: every position on a golf course has an expected number of strokes required to finish the hole from that spot, based on historical data from all professional rounds. SG measures how many strokes a player gained or lost relative to that expected benchmark on each shot.
Take an approach shot from 150 yards in the fairway. The tour average from that position might be 2.9 strokes to complete the hole. If a player hits it to six feet and holes the putt, he’s taken 2 strokes from that position — gaining 0.9 strokes on the field. If he misses the green, takes a chip and two putts, he’s taken 4 strokes — losing 1.1 strokes on the field. Repeat this calculation for every shot across every round, and you have a granular picture of where each player is gaining and losing strokes relative to tour average.

The system was officially incorporated into PGA Tour statistics in 2011, which is when it became publicly accessible at scale. The DP World Tour has since adopted its own shot-tracking infrastructure, though the data coverage and historical depth is somewhat less comprehensive than the PGA Tour’s ShotLink system. LIV Golf added shot-level data to their public leaderboards in early 2025, going back to 2024 seasons — a development that opens up SG analysis for players competing exclusively on that circuit.
What makes SG particularly valuable for betting rather than just for player development is that it disaggregates performance into components. A player can have a good scoring week on the back of exceptional putting while their ball-striking deteriorates — and SG will show that clearly even if the scorecard doesn’t. For a punter assessing whether a player is genuinely well-positioned for the following week, that disaggregation is essential information that a results-only analysis would miss entirely.
The Four Categories and What They Actually Measure
The full SG framework divides a round of golf into four categories, each capturing a distinct phase of play. Knowing what each measures — and crucially, how stable each metric is across time — is fundamental to using it correctly in a betting context.
SG:Off-the-Tee measures how a player performs on all tee shots, predominantly with the driver but including par-3 tees. It captures both distance and accuracy in a single number, which is why it superseded the older fairways-hit statistic. A player who bombs it 310 yards to the rough but leaves themselves in better position than tour average is still gaining strokes off the tee, even if they missed the fairway. The old stat couldn’t capture that.
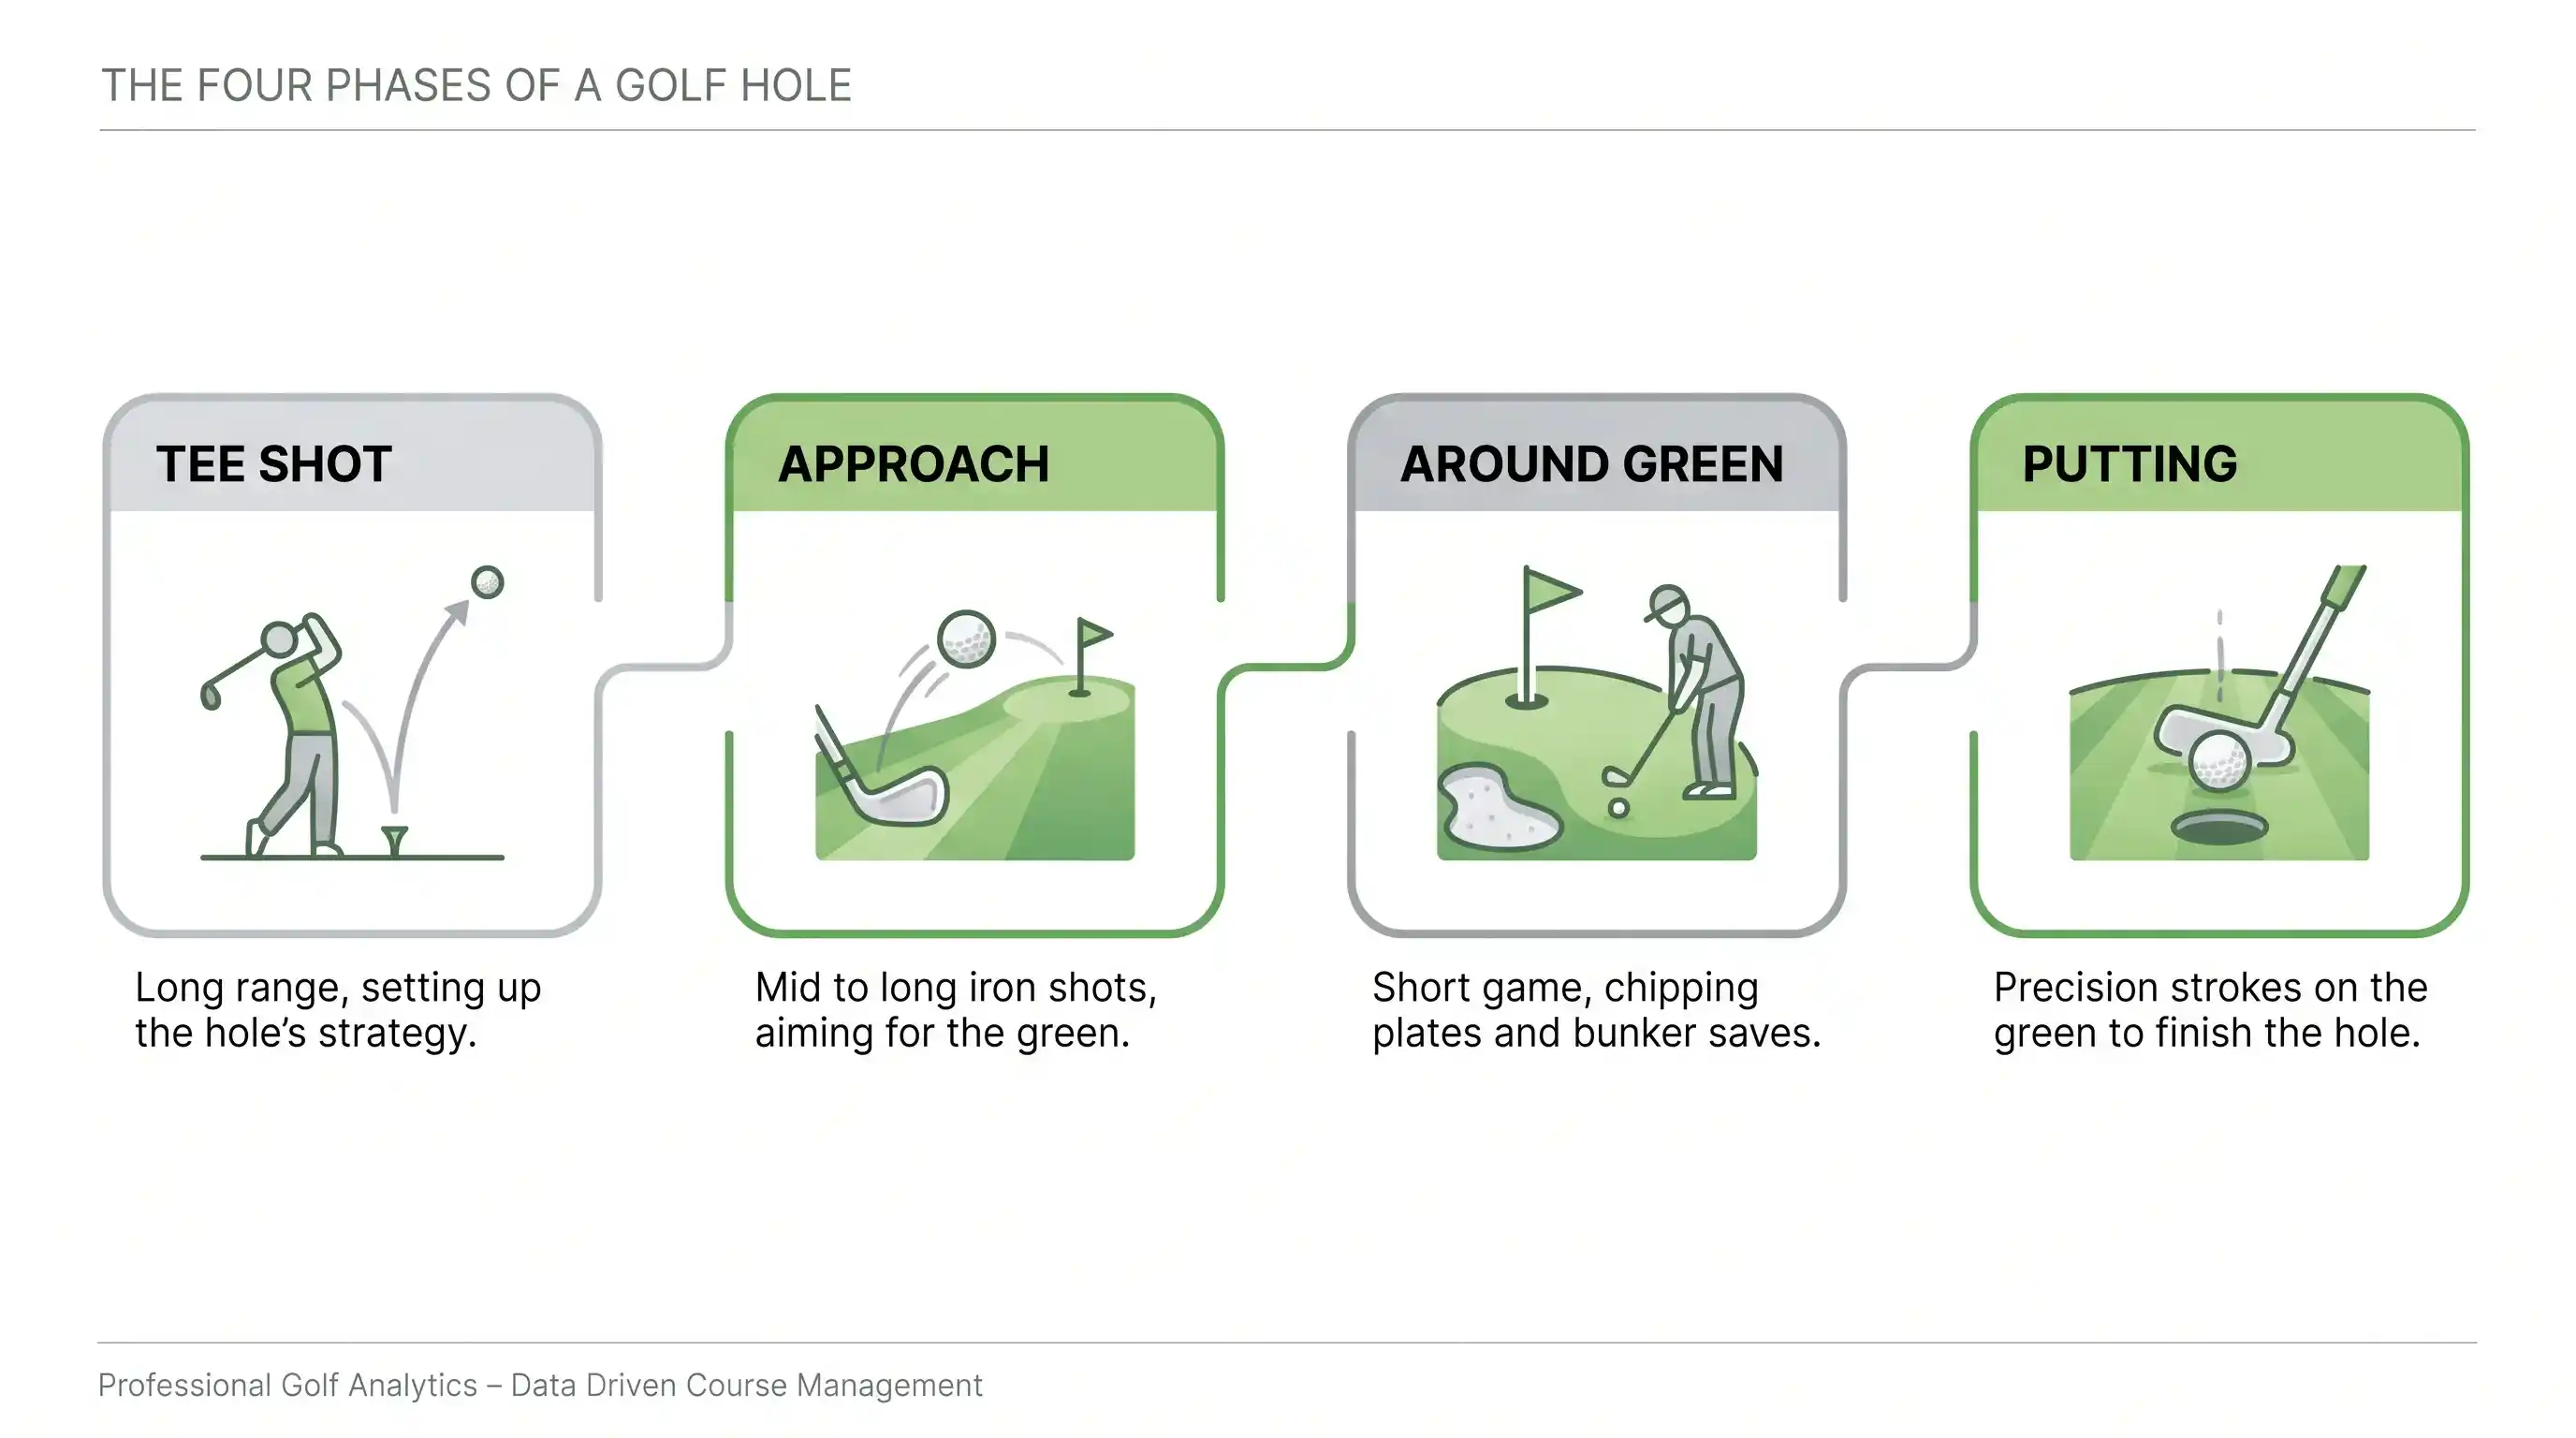
SG:Approach-the-Green covers all shots from outside 100 yards that aren’t tee shots on par-3s. This is the category with the strongest correlation to scoring outcomes in almost every analysis I’ve seen. Hitting greens from 150+ yards in a position that leaves short putts rather than long ones creates a compounding advantage across 72 holes that shows up strongly in final leaderboard positions.
SG:Around-the-Green captures the short game — chips, pitches, and bunker shots from within 30 yards. Highly skilled, obviously important, but less consistent week-to-week than the ball-striking categories. A player who leads the tour in SG:Around-the-Green one month can regress significantly the next without their technique having genuinely changed.
SG:Putting is the most discussed and, from a predictive standpoint, the least reliable of the four. Putting performance at tour level is subject to a level of variance that other categories aren’t — green-reading luck, the randomness of lip-outs and kick-ins, and genuine week-to-week fluctuations in form all conspire to make putting SG the most reverting of the metrics. As the research underlying SG consistently shows, ball-striking parameters are more predictive week to week than putting, which can appear almost random at short timeframes. So in general, when identifying players likely to contend, prioritising strong ball strikers and hoping their putters get hot is a more reliable framework than seeking out hot putters and hoping the ball-striking holds up.
SG:Tee-to-Green combines the first three categories into a single ball-striking composite. It’s the number I spend most time with in pre-tournament analysis, and the research behind it justifies that focus.
Why SG:Tee-to-Green Is the Metric That Wins Bets
Every time I’ve audited my own betting records to understand which pre-bet variables correlated with positive outcomes, SG:Tee-to-Green came out ahead of every other single metric. Not because it’s perfect — nothing is in a sport this complex — but because it captures the most durable and repeatable elements of golf performance in one number.
The practical evidence for this is visible in event-specific data. For the BMW PGA Championship, which runs at Wentworth and demands a specific combination of long iron play and approach precision, winners between 2019 and 2025 consistently ranked inside the top ten by SG:T2G in the weeks leading into the event. The Scottish Open, played at Renaissance Club on the east coast of Scotland, tells a similar story: in the six data years available through 2024, all six winners ranked inside the top four by SG:T2G for that specific tournament week.

That’s a strong signal. It doesn’t mean a top-four SG:T2G player will always win — the sample is small and there are other variables at work — but it does mean that players with strong ball-striking metrics relative to the field have consistently outperformed their price in these events. The bookmaker odds at the start of the week are built primarily around recent form and world rankings; SG:T2G creates an opportunity to identify players where the market has underpriced the ball-striking component.
How to use this practically: I look at a rolling 24-round SG:T2G average as a baseline metric for any player I’m considering backing. Twenty-four rounds represents roughly six tournaments, which is enough to smooth out single-event variance without becoming so lagged that it misses current form. For players who have changed their swing or coaching staff recently, I sometimes shorten this window to twelve rounds. For assessing whether a player genuinely fits a specific type of course, I’ll extend it to look at historical SG:T2G data from similar venues.
The course-fit dimension connects SG:T2G to something more specific. A links course like Royal Troon puts a premium on SG:Off-the-Tee over SG:Approach because approach shot difficulty is primarily determined by wind and lie rather than distance control alone. A parkland course like Wentworth tips in the other direction. Understanding which SG subcategory is most relevant to the week’s venue — and filtering your player selection through that subcategory rather than the composite — can sharpen your analysis considerably. I cover this in more depth in the guide on golf course fit betting strategy.
Expected Wins: Translating SG into Probability
Raw SG numbers tell you how a player is performing relative to tour average. Expected Wins (xWins), as developed by DataGolf, takes the next step and translates SG performance into win probability — asking not just “how good is this player right now?” but “given how good they are, how often should they win at a given event?”
The relationship is non-linear and depends heavily on field strength. A player averaging +3 strokes gained per round across all categories at a full-field PGA Tour event will win around 55% of the time. That sounds enormous until you consider what +3 strokes gained per round actually means: it’s an elite tier of performance, roughly the level of sustained dominance Tiger Woods showed at his peak or that Scottie Scheffler has approached in recent years. In an average field where the competition averages zero SG (by definition), that gap translates directly into a substantial win probability advantage.
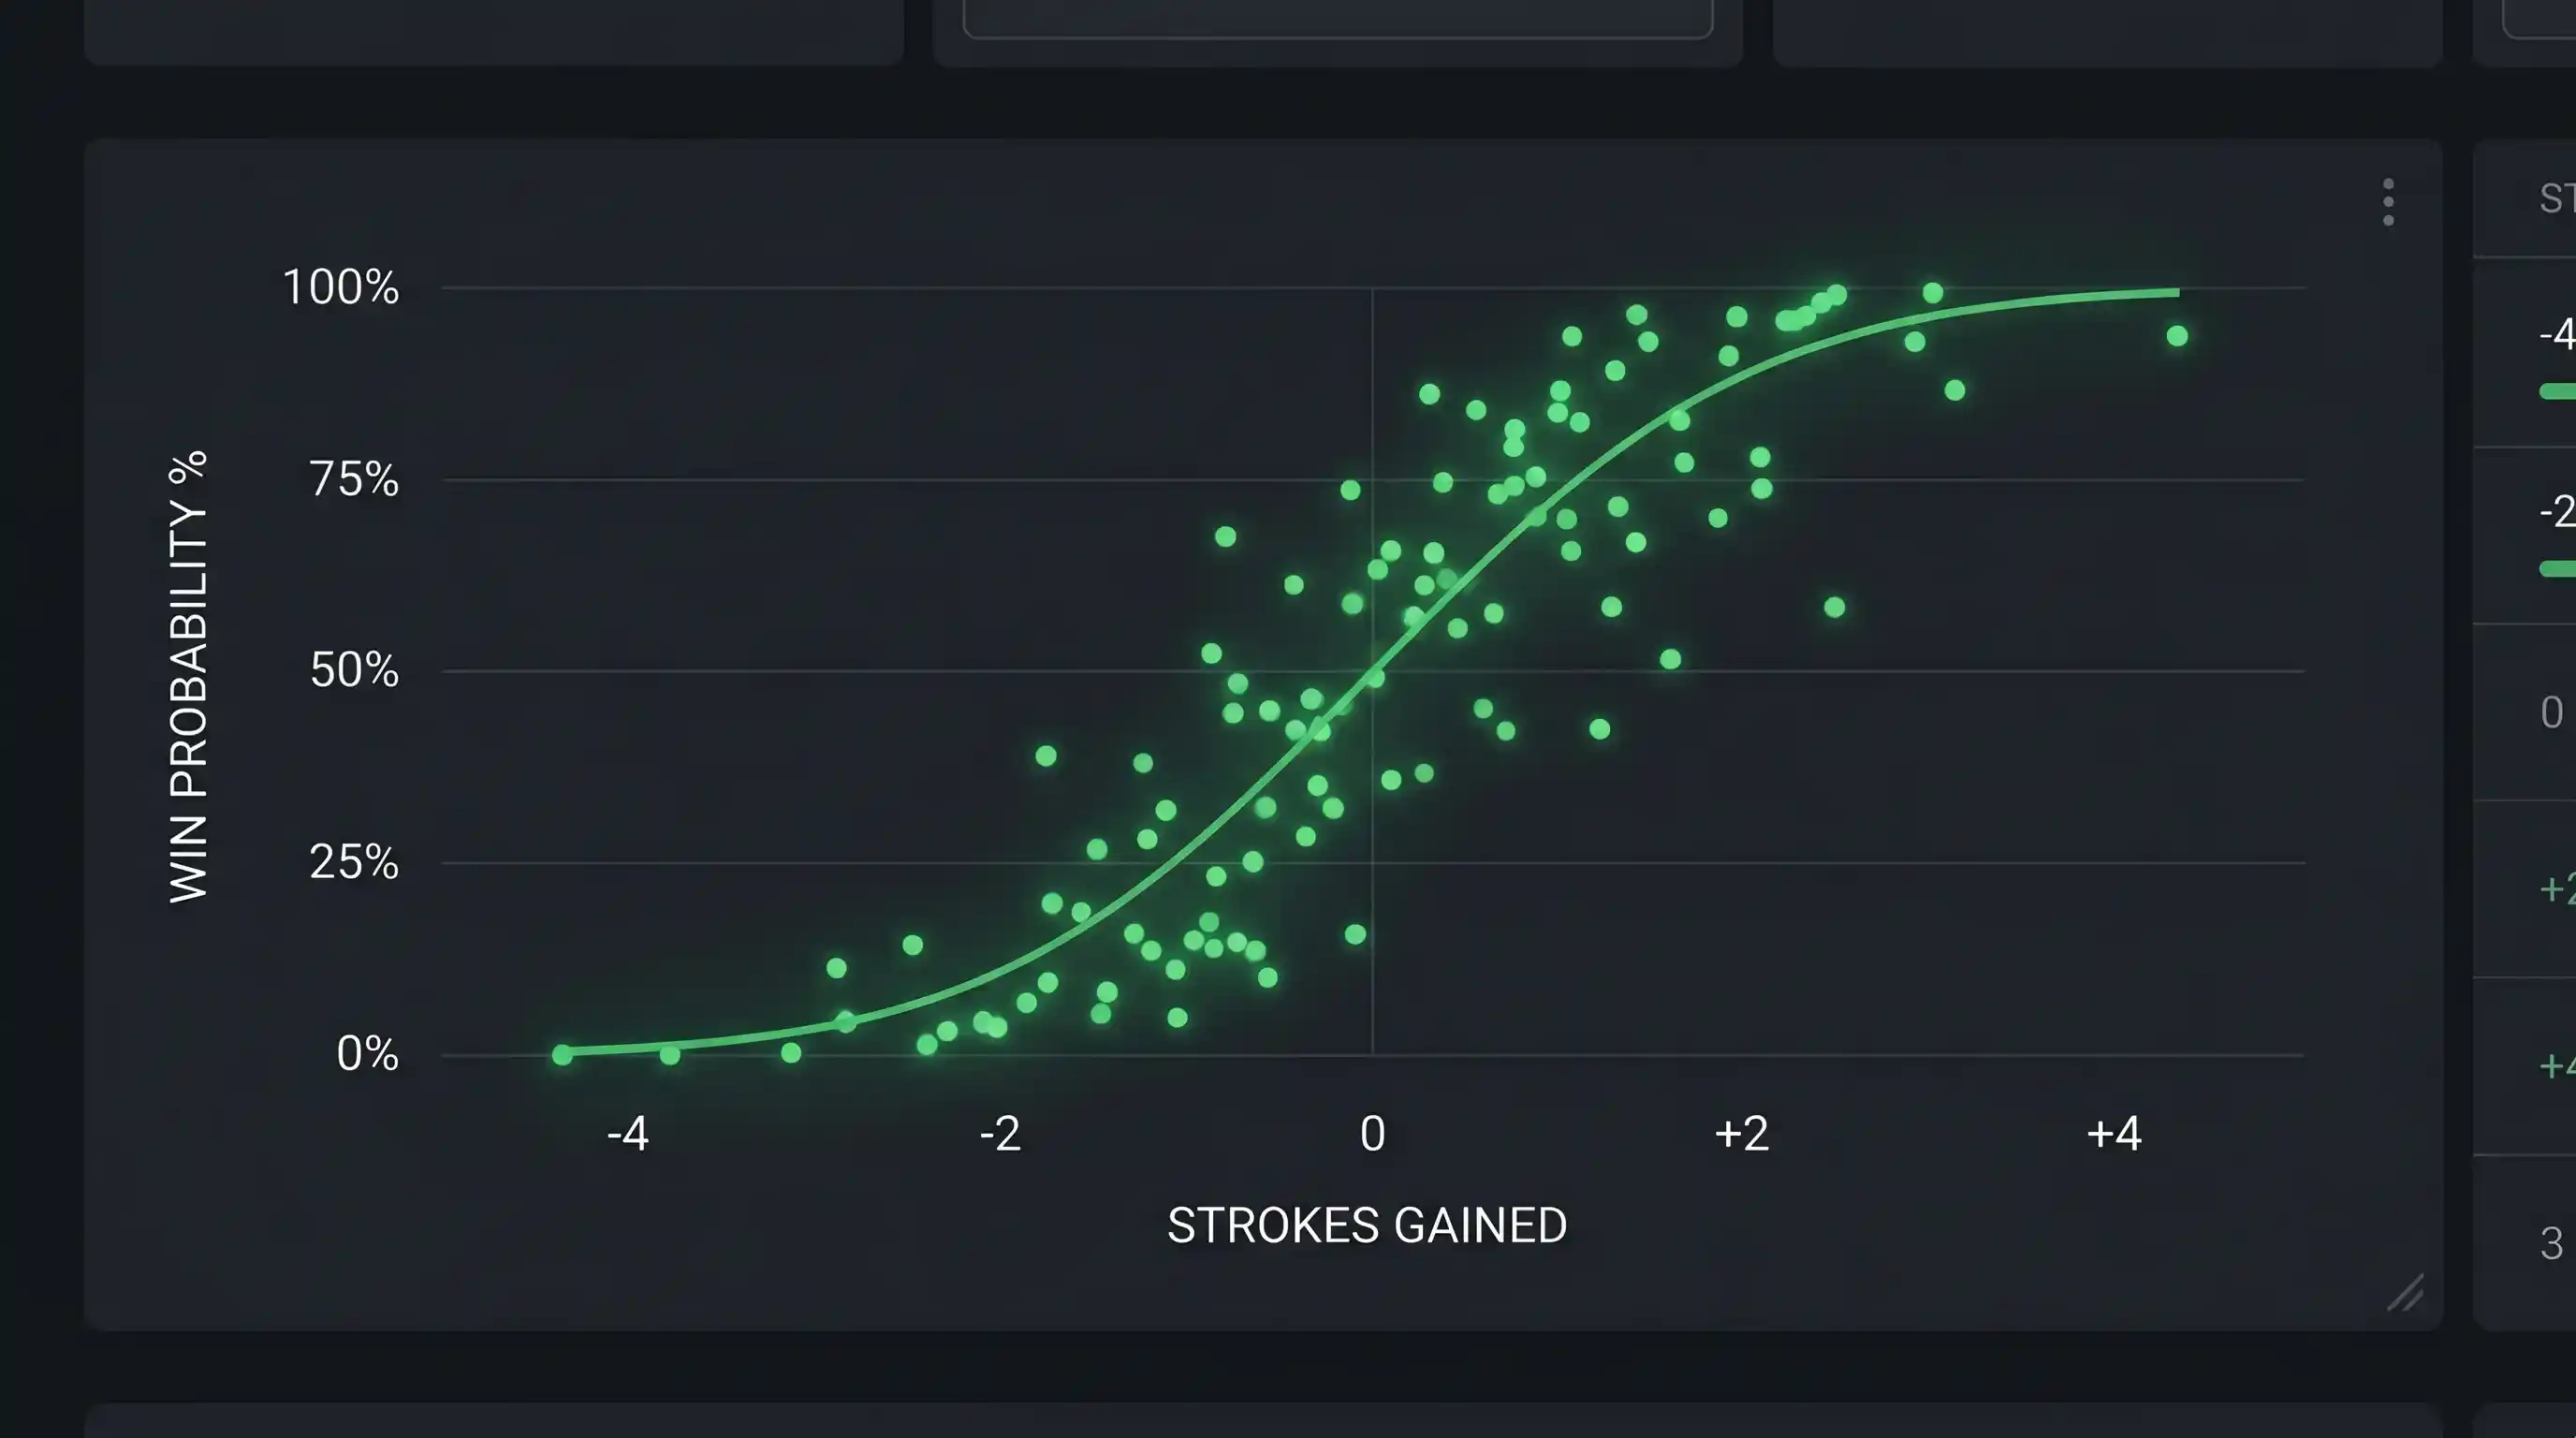
For the kind of player you’d actually be betting — a 20/1 to 50/1 shot with a rolling SG:T2G in the top 15 of the field — the Expected Wins metric gives you a probability estimate that you can compare against the implied probability in the bookmaker’s odds. If the market has a player at 33/1 (implied probability: roughly 2.9% after stripping out overround), but their xWins estimate based on current SG form suggests a 4-5% win probability, you have a candidate for a positive-EV each-way bet.
DataGolf publishes xWins estimates publicly, updated weekly during the golf season. The free tier of their site is sufficient for most punters’ needs — it shows current SG ratings, course-fit models, and win probability estimates for each field. The methodology involves adjusting raw SG numbers for the strength of competition faced, which is an important refinement: a player who racked up excellent SG numbers in a weak-field event shouldn’t carry the same weight as identical numbers from a strong-field Rolex Series event.
The honest limitation of xWins is that it operates on a simplified model of golf outcomes. It assumes players perform in future events at approximately their recent SG level, adjusted for field strength and course fit. In practice, there are injury variables, motivational factors around specific tournaments, equipment changes, and weather conditions that no model fully captures. I use xWins as a filter and a probability anchor — to identify candidates worth investigating further — not as a final answer. A player whose xWins estimate is well above their implied market probability has earned my attention. Whether they end up being a bet depends on the additional analysis.
Using SG Data in a Pre-Tournament Workflow
The data is only useful if it feeds into a consistent process. Here’s how I actually use SG in the week before a tour event.
Step one: pull the rolling SG:T2G numbers for the week’s field, sorted highest to lowest. I’m looking for players who rank highly by this metric and whose price suggests the market hasn’t fully priced in their ball-striking quality. A player ranked third in the field by SG:T2G who is priced at 28/1 when the first and second-ranked players are at 8/1 and 14/1 is worth further investigation.

Step two: check the xWins estimate on DataGolf for any player who cleared the first filter. Compare it to the implied probability from the best available price after stripping out the bookmaker’s overround. If xWins gives 4.5% and the clean implied probability is 3.1%, the gap exists. Whether it’s large enough to bet is a judgement call that factors in course fit, recent trend in SG (rising or falling), and schedule context.
Step three: apply the course-fit filter. SG:T2G is a composite, and what drives it varies by venue. For a links course, I weight SG:Off-the-Tee more heavily. For a precision parkland, SG:Approach. For a course with notoriously difficult greens, SG:Around-the-Green earns a second look even if I usually discount it. This step often eliminates players who looked interesting from the raw SG:T2G number but whose subcategory profile doesn’t fit the week’s demands.
Step four: check course history. This is supplementary to SG but it captures something the model doesn’t — how a specific player responds to a specific venue. Some players consistently overperform their SG metrics at certain courses. Some underperform. A two or three-year pattern of strong performances at a venue that don’t fully show up in SG:T2G rankings is worth noting, though I treat it as a tiebreaker rather than a primary signal.
Step five: check the each-way terms available and identify whether the bet structure makes sense given the price. A player at 20/1 with five-place standard terms produces a different risk profile than the same player with eight places available. If the terms are favourable and the SG analysis supports the selection, the bet goes in. If the terms are standard and the price has already compressed since markets opened, I often pass and wait for a better opportunity the following week.
When Strokes Gained Misleads You
Strokes Gained is the best analytical tool available for golf betting. It is not a complete picture of golf outcomes, and treating it as one leads to predictable mistakes.

The most common failure mode I’ve seen — in my own betting records and in the analysis of others — is over-indexing on SG form for links golf. The Scottish Open data I mentioned earlier, where all six winners between 2019 and 2024 ranked inside the top four by SG:T2G, is genuine. But links golf introduces variables that SG:T2G doesn’t capture: the ability to manufacture scores from unpredictable lies, the strategic decision-making around playing away from trouble in wind, and a form of recovery play that’s qualitatively different from parkland recovery. Some players’ SG numbers are partly an artefact of the conditions they’ve played in recently. Moving them to links conditions can expose weaknesses the model doesn’t flag.
Putting variability is another genuine limitation. Because SG:Putting is the most volatile of the categories, players who are “due a good putting week” based on their long-run average but who’ve been putting below trend recently represent a category of picks that SG suggests but betting markets don’t fully price. This is potentially interesting — but it’s also a domain where the signal is weakest. I’ve placed too many bets on “ball-strikers whose putting should normalise” and watched them miss the cut by three shots because the putts never came. The lesson: weight SG:T2G heavily, treat SG:Putting information as supplementary, and maintain appropriate uncertainty about putting-dependent scenarios.
Schedule context is entirely outside the SG model. A player with excellent SG numbers who has played four consecutive weeks may be fatigued. A player returning from injury may have limited data and high uncertainty around their true current level. These qualitative filters don’t appear in any quantitative model, and they’ve saved me from several bets that looked compelling on paper but fell apart in reality.
Finally, there’s the question of data lag for certain players. DP World Tour SG data has historically been less granular and less publicly accessible than PGA Tour data. Players who primarily compete on the European circuit — and who rarely appear in PGA Tour events where ShotLink coverage is comprehensive — can have thin or unreliable SG records. For these players, a more traditional form analysis combined with whatever SG data exists is often more honest than forcing an SG-first framework onto limited information.
Frequently Asked Questions
What is the difference between SG:Tee-to-Green and SG:Putting for betting purposes?
SG:Tee-to-Green measures all ball-striking performance from tee to green and is a composite of off-the-tee, approach, and around-the-green categories. It is more stable week-to-week and more predictive of tournament outcomes than SG:Putting, which is highly volatile and can fluctuate significantly across short timeframes. For betting, SG:T2G is the primary filter for identifying contenders. SG:Putting is useful context but should not be the primary basis for a selection because its randomness makes it unreliable as a predictive tool at the timescale of a single tournament.
Where can I find free Strokes Gained data for PGA Tour and DP World Tour players?
DataGolf.com is the most comprehensive free public resource for SG data and includes win probability estimates, course-fit models, and rolling averages updated throughout the golf season. The PGA Tour"s official website publishes SG statistics in its stats section for PGA Tour events. For DP World Tour events, the official tour website publishes some SG-equivalent data, though the coverage and historical depth is less comprehensive. DataGolf indexes some European Tour data and is the best single source for cross-tour comparison.
How many rounds of SG data do I need before a player"s stats become reliable?
As a general rule, 24 rounds (roughly six events) provides a reasonably stable baseline for SG:T2G and SG:Approach. These categories stabilise faster than SG:Putting, which may require 40 or more rounds before the signal outweighs the noise. For players returning from injury or a long break, treating anything less than 16 recent rounds with significant caution is sensible. A player with only four rounds of data from one event is essentially unmeasured — the uncertainty around their true level is too high to rely on the numbers.
Can Strokes Gained be used for LIV Golf betting as well?
Yes, with caveats. LIV Golf added shot-level data to their public leaderboards in early 2025, going back to 2024 seasons, which makes basic SG analysis possible for LIV players. The limitation is depth — two seasons of data is thin compared to the multi-year records available for established PGA Tour players. Additionally, LIV field strength is variable, and without consistent co-sanctioned events, cross-tour SG comparisons carry more uncertainty. For LIV players who also competed regularly on the PGA Tour or DP World Tour, their historical data from those circuits remains the more reliable SG record.
This material was created by SwingEdge team.
