


The concept of value betting is older than golf itself — it predates professional sport entirely. But the golf betting market applies it in a specific way that most UK punters have not internalised: you are not trying to pick winners, you are trying to find bets where the odds offered exceed the true probability of the outcome. I backed a 40/1 shot last season who missed the cut. That was a good bet. I once backed a 4/1 favourite who won comfortably — and it was a bad bet because my true probability estimate was 14%. Results and edge are not the same thing. Value is in the calculation, not the result.
What Value Actually Means in Golf Betting
A value bet is one where the implied probability from the bookmaker’s odds is lower than your estimated true probability of the outcome occurring. In decimal odds terms, a price of 10.00 (9/1) implies the bookmaker believes the outcome has a 10% probability (1 divided by 10.00). If your analysis suggests the true probability is 13%, you have a 3-percentage-point edge on the bet — and placing it consistently over many events will produce a long-term profit.
The UK online sports betting market is the largest segment of the country’s online gambling industry, representing over 57% of sector revenue. That scale means the golf outright market attracts serious sharp money, particularly at major events — and sharp money tightens the market. The best value in UK golf betting is typically found in smaller-field DP World Tour events, niche markets (cut betting, top-finish, matchup), and in the window immediately after market opening before the sharp money has moved the line.

One important nuance: the UK online sports betting market generated revenues approaching $5 billion in 2025 and is projected to grow steadily through the decade. More market participants means more sophisticated pricing — which means the edge available to a systematic punter who is not using SG-based models is narrowing. The punters who are consistently finding value are the ones with better probability models than the bookmaker, not the ones with better gut instincts.
Calculating Overround in a Golf Market
Overround is the bookmaker’s built-in margin — the percentage by which the sum of all implied probabilities in a market exceeds 100%. In a perfectly fair market, all implied probabilities would sum to exactly 100%. In a typical PGA Tour outright market with 156 players, the sum of all implied probabilities might be 130-140%, meaning the bookmaker has a 30-40% margin built into the market.
Calculating overround for your specific selection is more important than the market-wide overround. Different segments of the market carry different margins: market leaders (top 10 at short prices) tend to carry tighter margins because they attract the most market attention and sharp money; longshots (50/1 and beyond) carry wider margins. This means that finding value in a golf outright market is systematically harder among the favourites and systematically more possible among the longer-priced players.
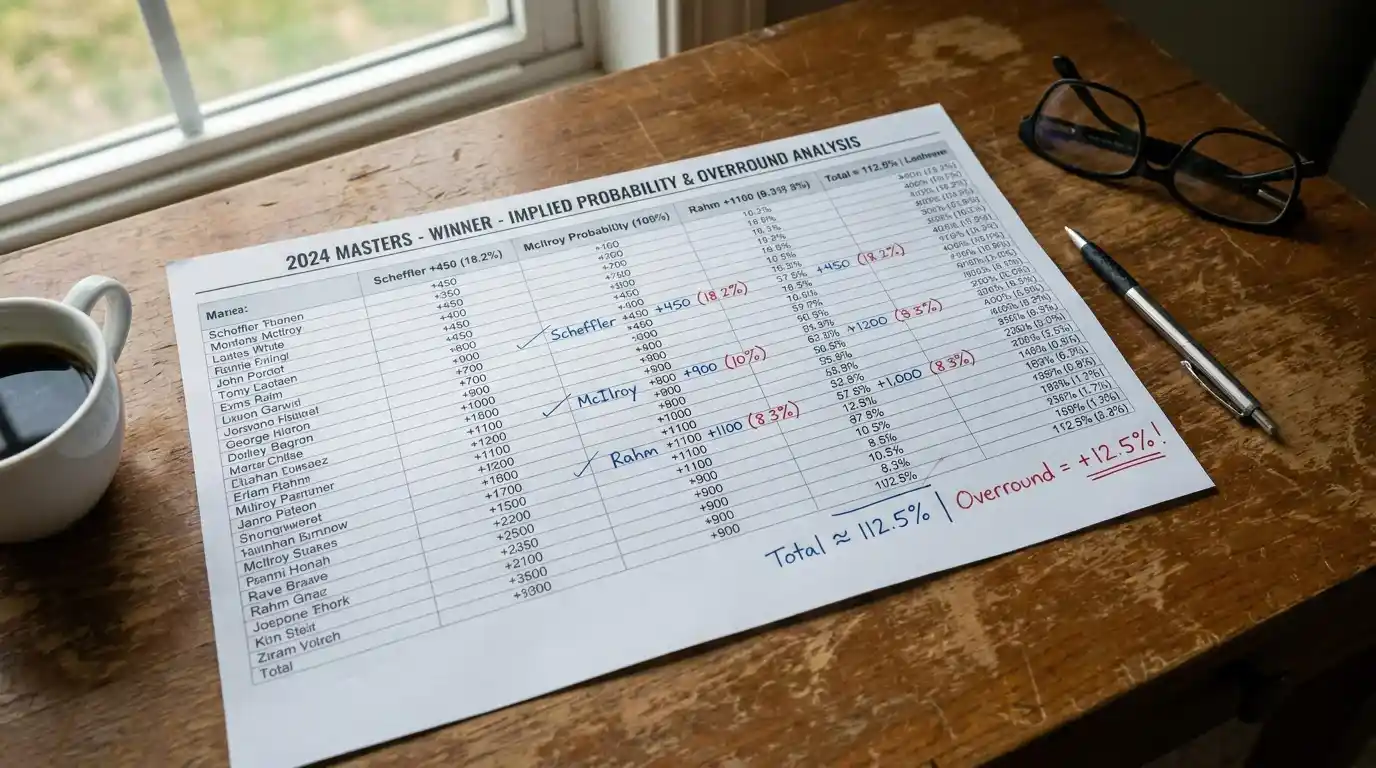
To calculate the implied probability for any UK fractional odds: divide 1 by (odds numerator / odds denominator + 1). So 16/1 has an implied probability of 1 / (16/1 + 1) = 1/17 = 5.88%. For decimal odds, divide 1 by the decimal price: 1 / 17.00 = 5.88%. If your true probability estimate for that player is 8%, the bet has a 2.12 percentage-point edge. At 16/1 returns of 1700% on stake, a 2.12% edge corresponds to roughly 36% expected profit per unit staked — substantial edge if your estimate is correct.
Finding Edge with SG Data
The most reliable source of edge in UK golf betting is the gap between a player’s SG performance and their market price. The DataGolf Expected Wins framework makes this concrete: a player averaging +3 SG per round across all participants in a full-field PGA Tour event wins roughly 55% of the time when they hit that performance level. The bookmaker prices that player at whatever the market consensus dictates, which may or may not reflect that 55% figure accurately. The gap between the implied market probability and the SG-derived probability is the value calculation.

In practice, identifying a player whose SG:T2G data places them in the top 10% of the field but who is priced as a 25th-percentile chance is where the edge lives. This happens most often when a player has had a run of visible poor results (missed cuts, weekend rounds where they were already eliminated) that obscure an underlying SG profile that remains strong. The market prices visible results; the SG data prices actual performance. The gap between the two is the value bet.

Practical Habits for Finding Golf Value Consistently
Value in golf betting is not found once and held forever — it has to be found repeatedly, which means developing consistent habits around how you approach each event. My pre-event process takes about two hours and covers four areas: pulling the current SG:T2G rankings for the entering field, reviewing the course profile for this specific setup (firmness, rough penalty, green size, historical scoring patterns), comparing the top SG performers to their current outright price, and checking the each-way terms available across my main accounts.
The discipline is in the comparison step. A player who ranks 5th in the field on SG:T2G but is priced as the 15th-best chance by the market is a value proposition regardless of whether I “fancy” them narratively. A player who ranks 15th in the field on SG:T2G but is priced as the 5th-best chance is a bet-against proposition regardless of their name recognition or recent headlines. The SG data is not the only input — course fit and historical venue performance add important context — but it is the anchoring quantitative measure that prevents me from letting narrative bias drive selection decisions.
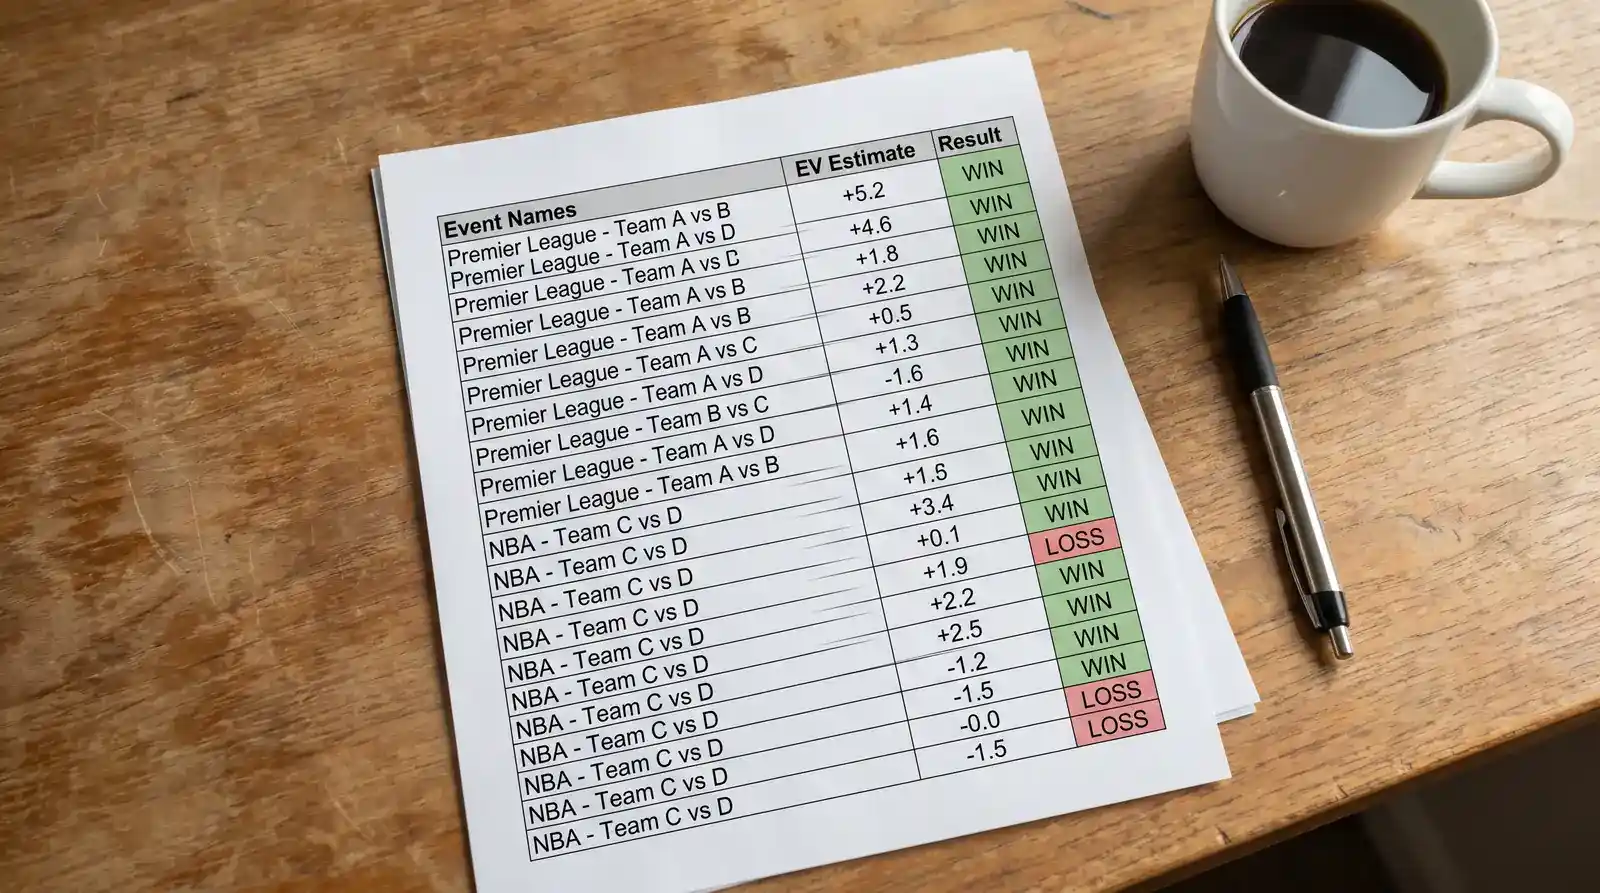
Over a season, the punters who consistently find golf value are those who have a repeatable process they can apply to every event, not those who occasionally identify an exceptional situation. The edge compounds from doing the same analysis correctly every week, not from occasional brilliance.
For the complete SG-based analytical framework and how to translate it into systematic probability estimates, the strokes gained golf betting guide covers the full methodology including DataGolf’s Expected Wins metric and how to weight SG categories by venue type.
What overround is typical for a full-field PGA Tour outright market?
A full-field PGA Tour outright market with 156 players typically runs to 125-140% overround, meaning the sum of all implied probabilities exceeds 100% by 25-40 percentage points. The specific overround varies by bookmaker — operators who price their own markets tend to be tighter than those who follow market leaders; newer or less popular events may have wider margins than flagship events. Comparing the same outright market across three or four UK bookmakers and taking the best price systematically reduces the effective overround you are paying over a season.
How does DataGolf"s Expected Wins metric help identify value bets?
DataGolf"s Expected Wins metric estimates the probability of a given SG performance level resulting in a tournament win, based on historical data from PGA Tour events. By comparing a player"s Expected Wins probability to the implied probability from the bookmaker"s outright odds, you can identify whether the market is over- or under-pricing the player relative to their SG data. A player with a 10% Expected Wins probability priced at 7% implied (roughly 13/1) has positive expected value; the same player priced at 12% implied (roughly 7/1) does not.
This material was created by SwingEdge team.
