


DataGolf is the platform that changed the quality ceiling on what a serious golf bettor can do with publicly available data. I had been running my own rough SG calculations from PGA Tour statistics pages for two years before I discovered DataGolf, and the difference in precision was immediate. Not because DataGolf has access to fundamentally different data — the underlying SG metrics are the same — but because they have processed it into the specific outputs that a betting analytical framework needs: Expected Wins probability, course-fit adjusted rankings, field-relative performance metrics, and historical simulation data that tests which analytical models have actually worked. This article covers how to use the key DataGolf tools for UK golf betting.
Understanding Expected Wins
Expected Wins (xWins) is DataGolf’s flagship predictive metric. It estimates the probability that a given player will win a specific tournament, based on their current SG performance levels and the composition of the field. The metric answers the question that matters most for outright betting: given how this player is performing right now, how often would they win this event if it were run 100 times?
The calculation behind xWins uses historical simulation: DataGolf runs thousands of simulated tournament outcomes based on the distribution of SG performance across the field, and the Expected Wins percentage reflects how often a player wins in those simulations. A player averaging +3 SG per round across all participants in a full-field PGA Tour event wins roughly 55% of the time at that performance level. At the start of the year, LIV Golf also integrated shot-level data going back to 2024, making Expected Wins calculations possible for LIV players for the first time.

The betting application is direct: DataGolf’s xWins percentage for a player is a probability estimate based on current performance. The bookmaker’s implied probability, derived from the outright odds, is a market consensus estimate. The gap between the two is the value signal. A player with a 10% xWins probability priced at 7% implied (roughly 13/1) has positive expected value; the same player priced at 12% implied (roughly 7/1) does not. The gap does not tell you to bet automatically — it tells you which players are worth further investigation.
Expected Wins in Practice
Using xWins in practice requires one critical discipline: the comparison between xWins probability and market implied probability must be done at the same point in time. xWins calculations on DataGolf update as player performance data updates — after each event — and the bookmaker’s odds move continuously. Comparing a stale xWins figure (from before a player’s most recent event) to a current odds price will produce misleading signals in either direction.
My process is to pull the DataGolf pre-tournament rankings and xWins probabilities on Monday or Tuesday of each event week, after the entry list is confirmed but before the market has received significant sharp action. At that point, the xWins figure reflects current SG data and the market price reflects opening odds before significant movement. The comparison at that moment is the most useful signal for identifying where the market is potentially mispriced relative to performance data.

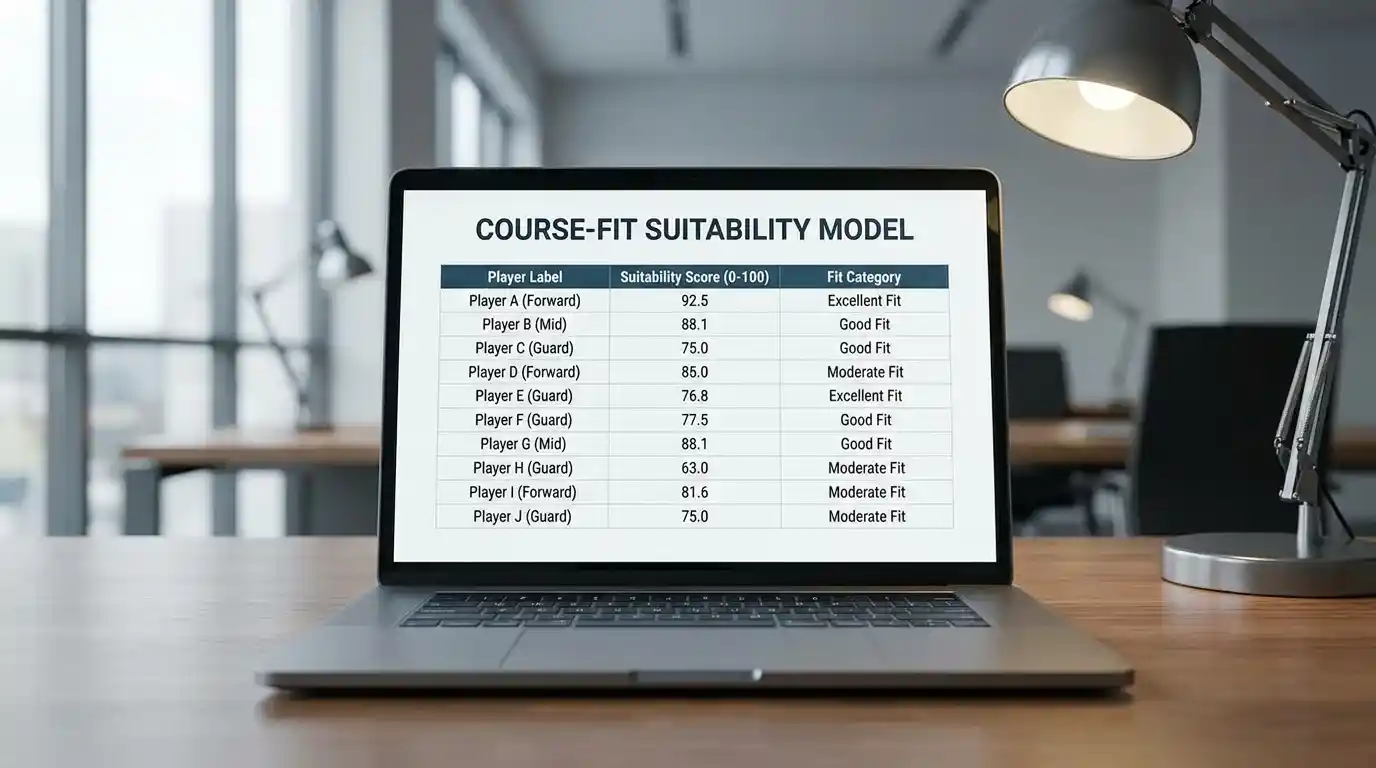
The specific xWins figure also needs context from the course profile. DataGolf’s course-fit model adjusts xWins predictions based on how well a player’s SG profile matches the specific course’s historical scoring patterns — which skills have been most important at this venue? This course-adjusted xWins is more accurate than the raw SG-based figure for events at distinct venue types, because it accounts for the fact that SG:T2G means different things at a precision iron-play course versus a distance-premium course versus a links setup.
Free vs Paid DataGolf Features
DataGolf operates a tiered model with meaningful free functionality and an expanded paid tier. The free tools include the pre-tournament player rankings, historical course statistics, and basic SG data for PGA Tour players. These free tools are sufficient for the core betting application: building a ranked list of the field by current SG performance and identifying players whose market price does not reflect their performance ranking.

The paid tier adds the full course-fit model with course-adjusted xWins, detailed simulated outcome distributions, field-relative performance metrics, and historical model performance tracking. For a punter placing a meaningful volume of bets each week, the paid tier’s incremental precision is likely worth the subscription cost. For occasional systematic betting, the free tools provide a strong analytical foundation that most casual punters in the UK market are not using.
One practical note for UK punters: DataGolf’s primary data coverage is PGA Tour events. DP World Tour coverage has been expanding, particularly for co-sanctioned events, but the depth of historical data and model calibration is stronger for PGA Tour. For DP World Tour-specific analysis, supplementing DataGolf with direct PGA Tour statistics portal data and DP World Tour official statistics is still necessary for complete coverage.
Building a Weekly DataGolf Workflow
The practical DataGolf workflow for systematic golf betting takes about 30-45 minutes per event week. On Monday or Tuesday, when the entry list is confirmed, pull the pre-tournament player rankings from DataGolf filtered to the entering field. Sort by course-adjusted Expected Wins. Identify the top 20 players on that ranking and compare each to the current bookmaker outright price. Calculate the implied probability for each price (1 / decimal odds) and compare to the xWins percentage. Any player where xWins percentage exceeds implied probability by more than 3 percentage points goes onto your investigation shortlist.
The investigation step applies the additional filters: course history, scheduling (rest vs fatigue), weather forecast alignment with player profile, and each-way terms for the specific event. Players who survive all filters with xWins percentage still substantially above implied probability are your selections. The discipline is in not bypassing this process — not backing a player because you like their story or because they played well last week without going through the full DataGolf-first workflow.

For the broader SG framework that DataGolf’s tools build on, the strokes gained golf betting guide covers the academic origins of the SG methodology, the individual categories, and how to interpret rolling SG data outside of the DataGolf platform.
Is DataGolf"s Expected Wins model based on PGA Tour or DP World Tour data?
DataGolf"s Expected Wins model is primarily calibrated on PGA Tour data, which has the deepest historical shot-level dataset through the ShotLink system. DP World Tour coverage has been added progressively, and co-sanctioned events that involve both tour members now feed into DataGolf"s model. For DP World Tour-only events, the model"s calibration is less robust than for PGA Tour events because the historical data depth is lower. At the start of 2025, LIV Golf also added shot-level data to their platform going back to 2024, which DataGolf incorporated into their calculations.
How does DataGolf"s course-fit model differ from raw SG:T2G data?
DataGolf"s course-fit model adjusts a player"s expected performance based on how well their specific SG profile matches what the historical scoring patterns at a given venue reward. Raw SG:T2G tells you how well a player has been striking the ball overall; the course-fit model tells you how much of that ball-striking quality translates to the specific demands of the venue in question. A player with strong SG:T2G driven primarily by driving distance may be less advantaged at a short, precision-heavy course than their overall SG figure suggests. The course-fit adjustment accounts for this venue-specific weighting.
This material was created by SwingEdge team.
