

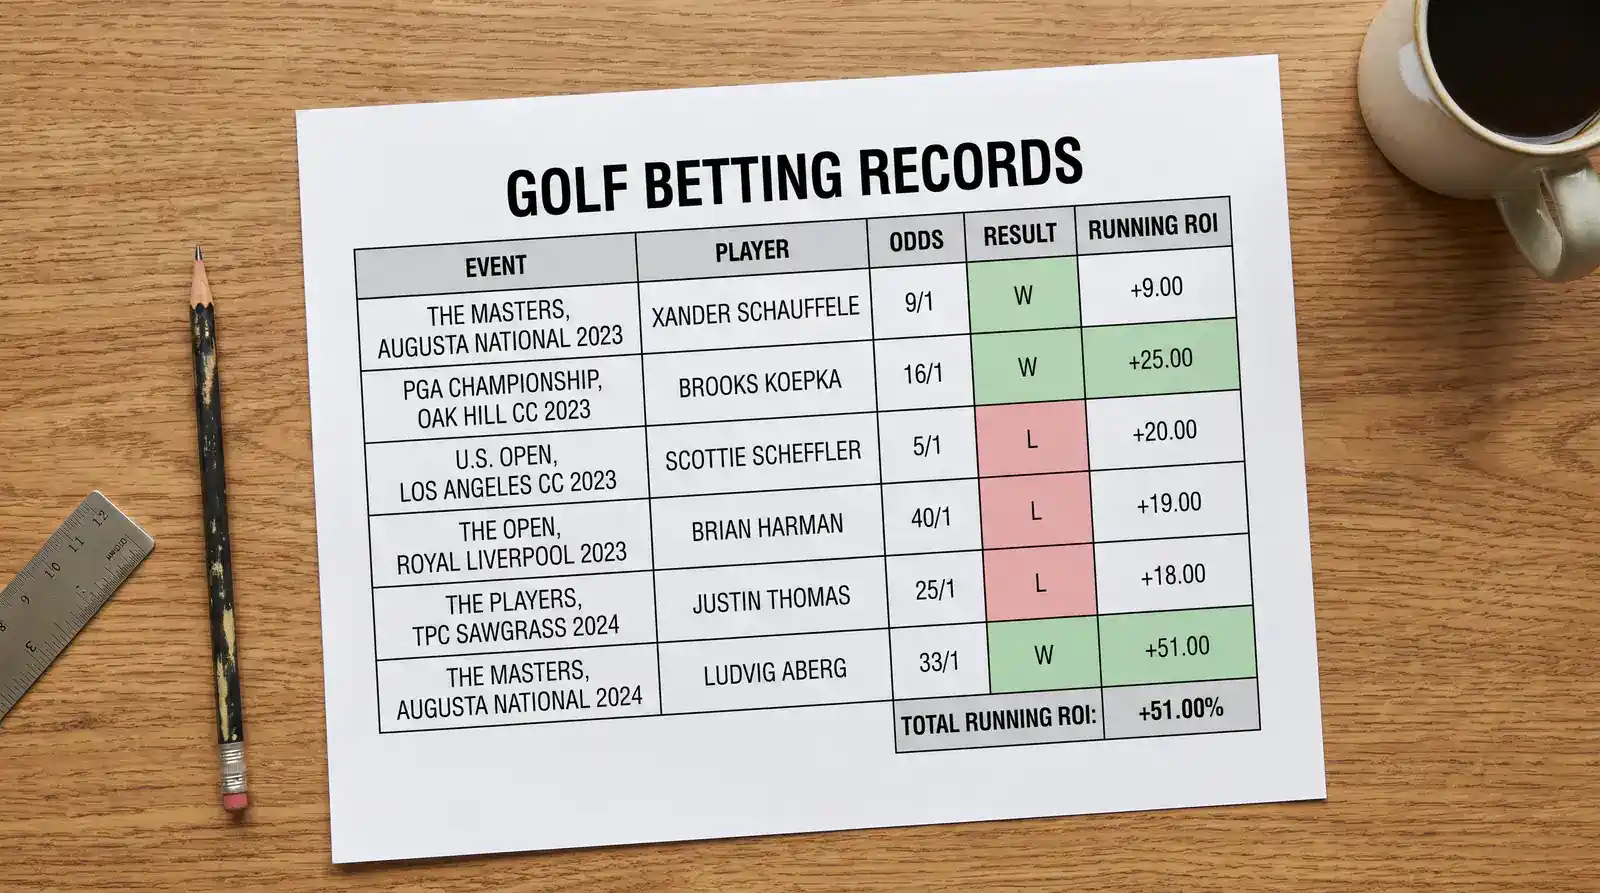
I kept no records for my first two years of systematic golf betting. I remembered the winners vividly — the 40/1 shot that came in on a Sunday in July, the each-way double that paid for a weekend away — and I had only a vague sense that the losers were somehow “bad luck” or “just outside the places.” Then I started recording everything, and the pattern that emerged was sobering: I was profitable on my SG-driven selections and losing money on everything I placed from narrative or intuition. The record was not telling me I was a bad punter; it was telling me exactly which part of my decision-making was producing edge and which was destroying it. That specificity is why record-keeping is not a bookkeeping chore — it is the feedback loop that makes improvement possible.
What to Record for Every Golf Bet
The minimum information you need in a golf betting record is: date, event, player, market type (outright, each-way, matchup, cut, FRL, etc.), odds taken, stake, bookmaker used, result, and return. That seven-field record per bet is enough to calculate your overall ROI and to split results by market type, which is the first level of analysis that produces actionable insight.
Beyond the minimum, the fields that generate the most analytical value are: analytical basis for the selection (SG-driven, course fit, wave advantage, or narrative), the player’s SG:T2G ranking at the time of selection, and your estimated true probability at the time of the bet. These additional fields allow you to verify over time whether your probability estimates are well-calibrated — whether the bets you rate at 10% true probability win approximately 10% of the time, or whether you are systematically over- or under-estimating specific types of selections.

Around 9% of UK adults participate in sports betting in any four-week window. Of those, a very small proportion keep systematic records detailed enough to generate the kind of market-type and method-type breakdowns that reveal genuine edges versus accidental wins. The gap between “I think I am profitable” and “I can demonstrate exactly where and why I am profitable” is the gap between optimism and evidence — and it is bridged only by records.
ROI and Yield Calculation
ROI (Return on Investment) and yield are two related but distinct metrics for measuring golf betting performance. ROI expresses your profit as a percentage of the total amount invested (staked). Yield expresses your profit per unit staked, typically expressed as a percentage of the total number of units bet.
For a concrete example: if you placed 50 bets totalling £500 in stakes and returned £540, your profit is £40. Your ROI is 40/500 = 8%. Your yield is 40 units profit from 50 units staked = 8%. In this simple case, ROI and yield are the same because each bet is one unit. When bet sizes vary — as they should under a proportional staking plan — the calculations diverge, and yield becomes the more useful benchmark because it normalises for stake size differences.

A positive yield of 5-10% in golf betting outright markets is genuinely strong performance over a meaningful sample size (100+ bets). The bookmaker’s margin in golf outright markets is typically 25-40% — meaning you need to outperform the market’s implied probabilities by a consistent margin to produce positive yield at all. Yield of 5% or above sustained over two or three seasons is evidence of a genuine analytical edge; yield of 15%+ in a single season is almost certainly variance rather than systematic edge.
A Practical Betting Log Template
The simplest effective betting log is a spreadsheet with one row per bet and calculated summary columns. The core columns: Date | Event | Player | Market | Bookmaker | Odds (decimal) | Stake (£) | EW? (Y/N) | Result (W/EW/L) | Return (£) | P&L (£). A running total of cumulative P&L and a running yield calculation in two summary cells at the top gives you a real-time view of performance without requiring any analysis beyond data entry.
The additional analytical columns that add the most value: Method (SG/Course Fit/Other), SG:T2G Rank in Field at Selection, My Est. Probability (%), Market Implied Probability (%). These columns allow you to calculate your average estimated probability versus your actual win rate by method, which is the key calibration check. If your SG-driven selections win at 11% when you estimated 10%, your estimates are well-calibrated. If they win at 5% when you estimated 10%, your SG analysis is systematically overestimating edge — or your sample size is too small to distinguish signal from variance.
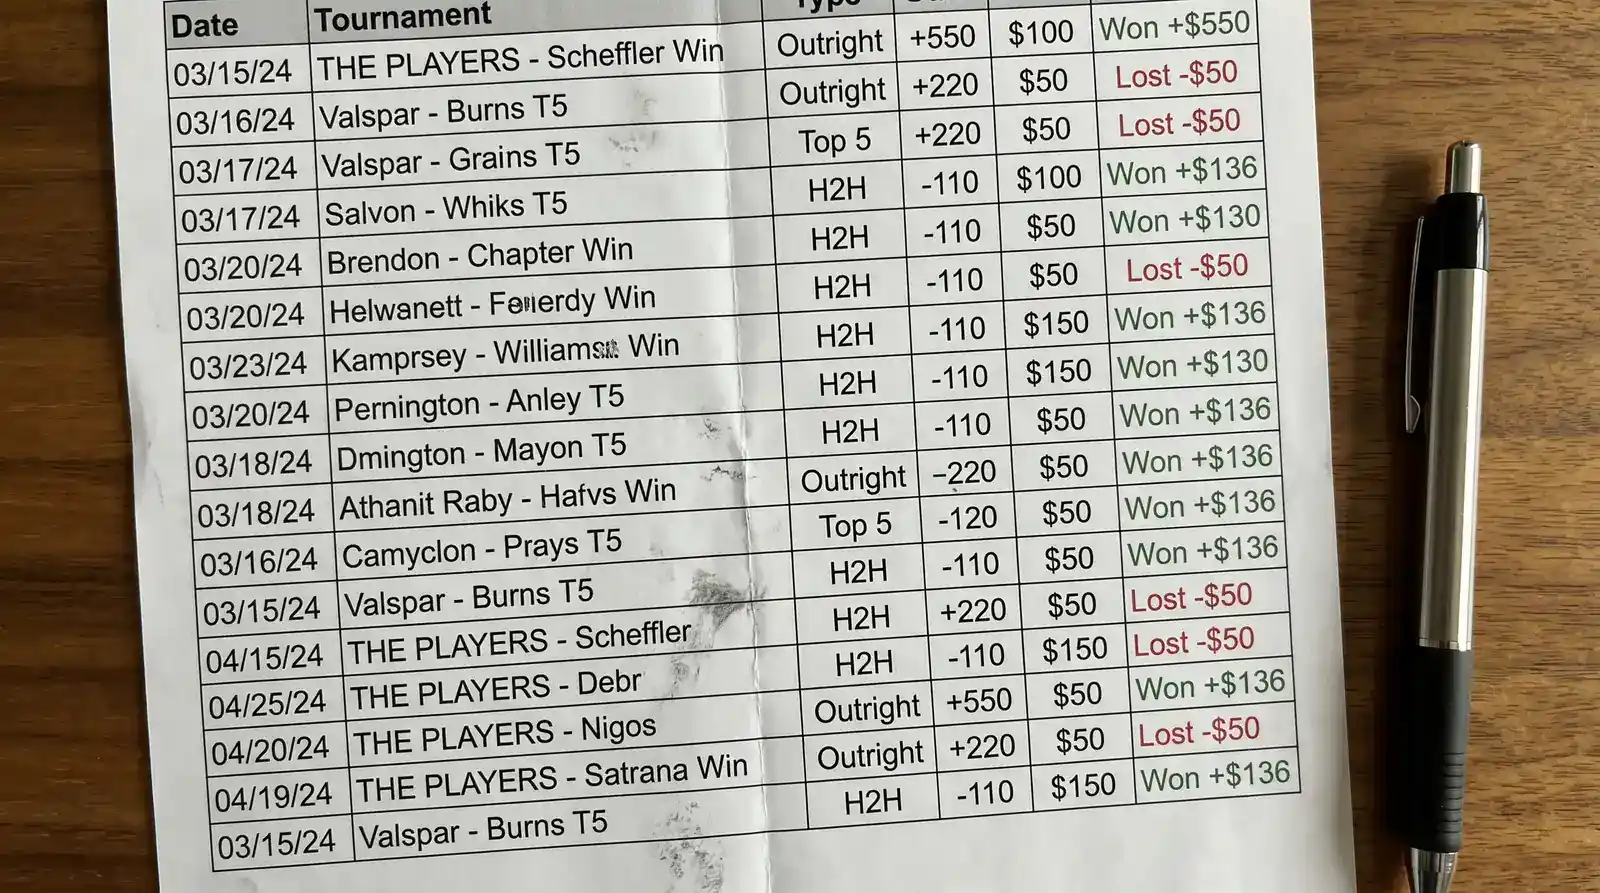
The minimum sample size for meaningful statistical conclusions in golf betting is around 100 bets by market type. With 10-15 outright bets per week and a full season of 35-40 events, you can accumulate a sample of 400-600 outright selections in a single year if you are systematic about it. At that sample size, a positive yield figure becomes statistically meaningful rather than potentially explainable by variance alone.
Using Records to Improve Your System
The most valuable use of a betting record is not measuring performance — it is identifying which specific decisions are driving performance in each direction. After 200 recorded bets, I sorted my outright selections by “method” and found that my SG-driven selections had a yield of +12%; my course-history-driven selections (not supported by SG data) had a yield of -8%; and my “narrative” selections — the ones I picked because I liked the story — had a yield of -22%. The record did not tell me to stop betting on golf; it told me to stop making two of the three kinds of selections I was making.

That kind of method-level attribution is only possible if you are recording the basis for each selection at the time of placing. Reconstructing the “why” after the fact is distorted by outcome bias — you remember the narrative selections that happened to win and forget the ones that lost. Recording the method before you know the result is the only way to get honest attribution data. It is the same principle behind scientific pre-registration: the discipline of committing to your hypothesis before you see the outcome is what separates evidence from storytelling.

For the staking framework that makes the numbers in your record consistent and comparable over time, the golf betting bankroll management guide covers unit sizing, drawdown management, and staking plan structures that keep your per-bet stakes comparable for ROI calculation purposes.
How many bets do I need before my ROI figures are statistically meaningful in golf?
A commonly cited threshold for statistical meaningfulness in sports betting is around 100 bets per market type or selection method. At that sample size, you can begin to distinguish consistent positive yield from variance, though the confidence interval remains wide. For golf outright markets, 100 bets might take six months to a year to accumulate at a systematic pace. A yield figure based on fewer than 50 bets — even a very positive one — tells you very little about whether you have a genuine analytical edge or whether you have simply run above expectation in a small sample.
Should I log each-way returns as one bet or split into win and place components?
The most analytically useful approach is to log each-way bets as a single entry but record both the win part result and the place part result separately. This allows you to calculate your yield specifically on the place portion of your each-way selections, which tells you whether you are finding genuine value in the place terms or whether your edge comes primarily from selecting outright winners. If your place-portion ROI is strongly positive and your win-portion ROI is near breakeven, you are benefiting from extended each-way terms rather than outright prediction. That is a useful piece of information for deciding where to focus further analytical effort.
This material was created by SwingEdge team.
